Retail businesses now collect information from sales systems, cameras, customer traffic, promotions, and daily store operations. The challenge is no longer limited to obtaining data. Teams also need to understand why figures change and what happens inside a store before a transaction takes place. AI is becoming an important part of retail intelligence because it can organize large volumes of store data and identify patterns that are difficult to find through manual review.
This matters especially for retailers, restaurants, and large chains with many physical locations. OVOPARK applies AI-based video analysis to customer traffic and in-store behavior analysis. In practice, the broader role of AI is to connect customer activity with operational information so that teams can investigate changes across stores, periods, and business conditions.
Why Store Analysis Needs More Than Sales Figures
Sales reports tell retailers what customers purchased, but they do not always explain what happened before the purchase. Two stores with similar revenue may have very different traffic and customer behavior.
For example, a decline in sales could be connected with fewer store visits. In another case, traffic may remain stable while customers spend less time around key product areas. A promotional display might also be located in a section that receives limited customer attention.
AI-based analysis adds behavioral information to traditional business figures. Traffic volume, movement patterns, and dwell time can be reviewed together with transaction data. This helps teams identify which part of the customer journey deserves closer examination.
For large chains, consistent measurement is also useful for store comparison. Regional teams can review common indicators across locations while considering differences in store size, local demand, operating hours, and customer habits.
Customer Movement Becomes a Useful Business Signal
The way customers move through a physical store contains information about how they use the space. Routes, stopping points, and dwell time can reveal which sections receive attention and which are often passed without much interaction.
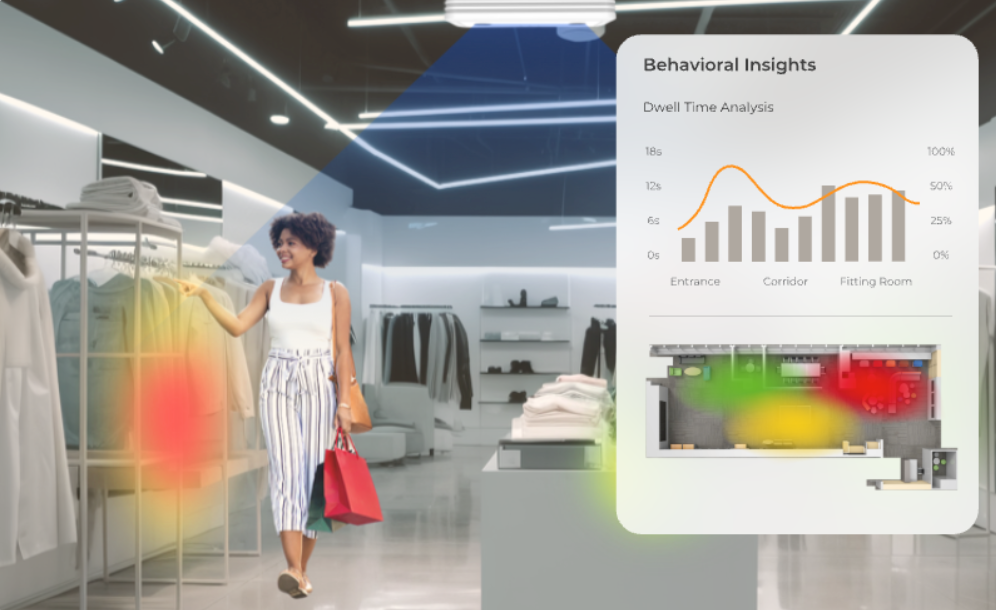
Heatmaps provide one way to visualize these patterns. They show differences in activity across selected store areas. Retail teams can use this information to examine whether entrances, shelves, displays, or promotional zones receive the expected level of customer attention.
The results need context. Heavy traffic near an entrance may simply reflect the store layout. A location with fewer visitors but longer dwell time may indicate stronger interest. Looking at both movement and stay patterns gives teams a more detailed view than counting visits alone.
These observations become more useful when compared over time. Weekday and weekend patterns, campaign periods, and layout changes can reveal whether customer behavior is temporary or recurring.
AI Connects Observation With Operational Questions
Useful retail intelligence solutions should help retailers investigate specific business questions rather than simply produce more reports.
Consider a retailer that changes the position of a seasonal display. Teams can compare customer traffic and dwell patterns before and after the move. If attention increases, sales data can then show whether additional exposure was followed by a change in purchases.
A similar method can be applied to store layouts. If one section consistently receives little traffic, managers can examine possible reasons. The issue may involve aisle arrangement, signage, nearby categories, or the route customers naturally follow after entering.
AI makes repeated comparisons easier across days and locations. However, the question should come first. Knowing what a team wants to investigate helps prevent large datasets from becoming another collection of figures without clear business context.
How Heatmaps Reveal Attention Inside a Store
Heatmap analysis is a practical example of how AI can turn customer movement into information that retail teams can examine. Instead of relying only on visual inspection, managers can compare activity across selected areas of a store.
This type of analysis is already used in retail environments. The Heatmap Analysis function from OVOPARK, for example, visualizes popular areas that attract customer attention. Retail teams can use these patterns to assess product displays and decide whether placement adjustments should be tested.
The same information can provide context for products that receive limited attention. If a lower-performing item is placed in a low-traffic section, teams may test another position along a busier customer route. Later traffic and sales results can show what changed after the adjustment.
This does not mean high traffic automatically produces higher sales. Heatmaps provide evidence about visibility and engagement. Product demand, pricing, availability, and merchandising still influence the final transaction.
Different Stores May Need Different Interpretations
AI analysis also highlights why similar stores can produce different results. One location may receive high traffic but convert a smaller share of visitors. Another may attract fewer people but record stronger purchasing activity among those who enter.
These situations require different responses. High traffic with weaker sales may prompt teams to examine conversion, product availability, queues, or merchandising. Lower traffic may shift attention toward local marketing, store visibility, or surrounding commercial conditions.
This is where retail intelligence becomes more useful than a single store ranking. Managers can examine relationships between several indicators rather than treating sales or visitor numbers as a complete explanation of performance.
Comparisons should also account for store format. A shopping mall location, street store, and restaurant may have very different traffic patterns. AI can organize the information, but the operating context remains important when interpreting it.
Human Context Still Shapes the Final Interpretation
Store data does not exist separately from the outside environment. Weather, holidays, local events, promotions, renovations, and staffing changes can influence traffic and customer behavior.
A sudden increase in visits, for example, may come from an event nearby rather than a merchandising change. A quieter store may still perform well because customers arrive with a clear intention to purchase.
For this reason, AI works better as an analytical layer than as a replacement for retail experience. It can identify patterns across large datasets, while store and regional teams provide the local knowledge needed to explain unusual changes.
This balance becomes increasingly important as businesses collect information from more physical locations. More data can reveal more relationships, but those relationships still need to be interpreted within the circumstances of each store.
What AI Changes in the Next Stage of Retail Analysis
The role of AI in future retail intelligence solutions may increasingly involve connecting information that was previously reviewed separately. Customer movement can be examined alongside traffic, sales changes, merchandising activity, and differences between locations. This provides a fuller picture of what happens before results appear in a sales report.
The change also affects the questions retailers can ask. Instead of only checking how many people visited or how much a store sold, teams can investigate where attention changed, when behavior shifted, and which operational factors deserve closer review.
For physical retail, this represents a move from isolated metrics toward connected analysis. AI-based analytics can help identify relationships across store activity, while retail teams contribute the commercial and local context needed to interpret those patterns.